Earlier this month, Statistics Canada released the most recent results from its long-standing and impressive Canadian Community Health Survey (CCHS). The results were very encouraging for those who work to reduce tobacco use — smoking rates had declined to 13% – the lowest rate in our lifetime. Earlier in the year, another Statistics Canada survey (the Canadian Tobacco and Nicotine Survey, CTNS) had estimated that smoking rates had fallen even further — to 10%.
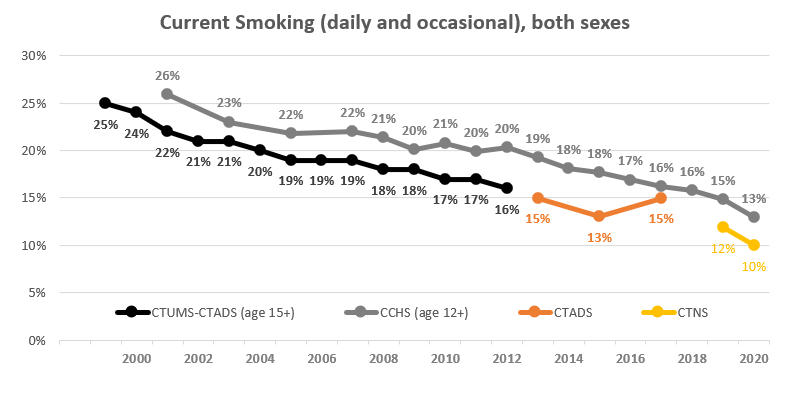 This is not a trivial difference in measurement of this major health issue: one study finds more than a half million more smokers than another. Nor is it the first time that the CCHS provided higher estimates than other surveys conducted for Health Canada.
For two decades there has been a gap of about 2 to 4 percentage points between the ‘official’ estimates produced by government surveys and used as indicators to track and assess programming and policy.
This post investigates whether different technologies used by these surveys contribute to the differences in these estimates, and also whether recent changes to CCHS methods may contribute to some of the decline.
Statistics Canada has reduced the number of in-person visits to collect information about the health of Canadians.
Data for the smoking surveys sponsored by Health Canada, including the Canadian Tobacco Use Monitoring Survey (CTUMS), the Canadian Tobacco, Alcohol and Drugs Survey (CTADS) and the Canadian Tobacco and Nicotine Survey CTNS) are collected through telephone interviews conducted from Statistics Canada’s call centre based in Ottawa.
This call centre is also used to conduct the majority of the interviews for the Canadian Community Health Survey. This survey also has a parallel data collection process conducted by Statistics Canada’s field interviewers, who are based across the country. These interviewers are trained to make personal contact with the dwelling that has been randomly selected and to conduct the interview in person (often at a at respondent’s home). If that is not possible, they then attempt to make contact by telephone.
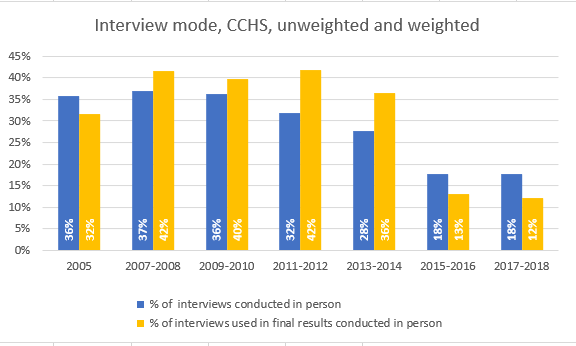 During the revamping of the CCHS in 2015, the number of interviews conducted by regional staff was reduced, from about 50% to 30%. During the same period, the share of these interviews that were conducted in person also fell – from about three-quarters in 2007-2008 to less than two-thirds a decade later. Statistics Canada recently reported that all in-person interviews were terminated after March 2020 and no information is yet available for 2019.
The diminishing share of person interviews to CCHS results for 2005 to 2017-2018 is shown below.
More people will say they smoke when they are speaking in person to a surveyor
Compared with telephone interviews, in person discussions appear more likely to result in Canadians identifying themselves as smokers.
In 2017 and 2018, for example, across all ages and both sexes those who were asked “At the present time, do you smoke cigarettes every day, occasionally or not at all?” were more likely to say they smoked if the interviewer could see them than if they were being interviewed on the telephone.
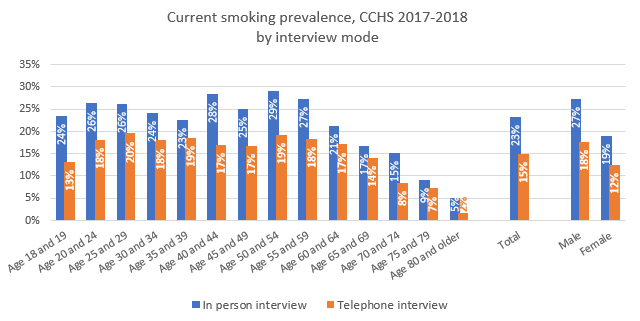 The difference was substantial: in 2017-2018 smoking prevalence estimates resulting from face-to-face discussions for men and women were about 50% higher (27% vs 18% for men and 19% vs 12% for women).
This survey mode effect appears to have grown over time
The gap between smoking rates estimated by in person interviews and telephone interviews has appeared in all of the CCHS waves over the past 15 years, but appears to have grown in recent years.
In 2005, there was a 1 percentage point gap between the estimate of smoking prevalence produced by 47,500 in person interviews and those produced by 84,800 phone interviews (22.4% vs 21.4%). A decade later , in 2015-2016, the difference had grown to 9 percentage points (25% estimated 19,600 in person interviews vs. 16.1% estimated by 90,000 telephone interviews).
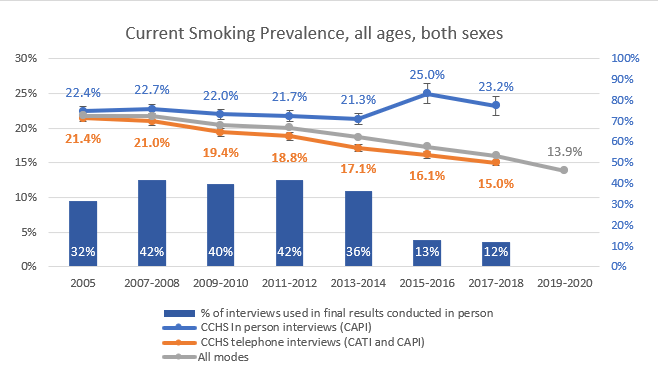 Notably, the number of interviews conducted in person for CCHS (19,600 in 2017-2018) is greater than the number of interviews conducted for the CTNS (8,614 in 2019) or CTADS (16,349 in 2017).
* Canadians should be cautious in interpreting the 2020 CCHS results for smoking behaviour as an indication that smoking has declined significantly during the COVID crisis.
* A review of the impact of survey modes on estimates of smoking behaviour is warranted.
A data sheet with CCHS estimates of smoking behaviour produced by telephone and in person interviews between 2005 and 2017-2018 is downloadable here.


